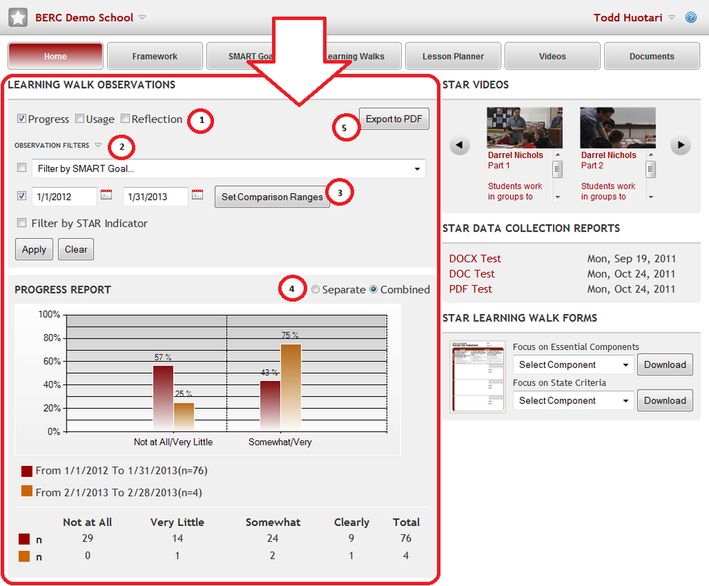
You might have noticed that we recently published updated reporting functionality for the Building version of STAR Online. This update enhances the robustness of reporting and makes it available on the Home page. Now, instead of only being able to view a chart and learning walk scores and notes for just one SMART Goal, you can pull from the all the data collected for your building and then filter down by SMART Goal, time range, or STAR Indicators. We've also added a table that shows the n numbers and broken the report up into three modular pieces - Progress, Usage, and Reflections - so that you can view and export any or all of them.
Here are the five key parts:
Here are the five key parts:
- Reports: The Progress report shows the chart and table, and allows you to view comparison groups such as time ranges or STAR Data Collections. The Usage report shows who been conducting STAR Learning Walks and how frequently. The Reflection report shows anonymous observation notes, grouped by score, and overall reflection and commitment data.
- Observation Filters: Expand the panel to narrow your results set down to a specific SMART Goal, time range, or group of focus Indicators.
- Set Comparison Ranges: Use this feature to compare your data set with another time range or STAR Data Collection.
- Chart Views: Toggle between Separate and Combined to view 1s, 2s, 3s, and 4s separately or combined results of 1s/2s and 3s/4s.
- Export to PDF: Download a PDF file of the report once you have the view you like and want to save it or share it with others.
Sound interesting?


